

You can now download the Environmental Declarations (ED) for all our products. Each Environmental Declaration includes both the product’s Carbon Footprint and the Paper Profile, with short explanations of the data behind them. You'll also find a GHG Protocol reporting table for each mill, along with background information on the energy sources and wood supply.
Download Environmental Declarations
Learn more about why we are now reporting in greater detail. We'll show you how increased knowledge may affect carbon emission reporting, as well as future developments aimed at minimising environmental impact.
Methods for carbon footprint calculations are still being refined
Why isn’t there a single quick-and-easy way to unambiguously state a product’s carbon footprint and compare it to others? Let's start with a brief history, then move on to environmental reporting in the paper industry and OECD’s most current reports on carbon footprint development. Lastly, we’ll highlight our Environmental Declarations for a wider understanding.
In the early days of carbon dioxide measurement
Carbon dioxide emissions first became regularly measured in the late 1950s, according to NASA. As a result, it became apparent that the amount of carbon dioxide in the atmosphere was increasing.
In 1988, the Intergovernmental Panel on Climate Change (IPCC) was formed to collect data and assess evidence on climate change.
The first official carbon footprint calculation, made in 2004, was criticized because it placed the focus on the individual consumption rather than on the responsibility of the companies whose actions were causing the emissions. It didn't help that the idea originated from an advertising company working for the oil company BP, British Petroleum.
But calculating carbon footprints caught on as a tool to facilitate a shared producer and consumer responsibility. The carbon footprint concept makes it possible to compare the climate impact on different levels, from individuals, products, and companies, to countries.
Tools for measuring carbon emissions from paper products
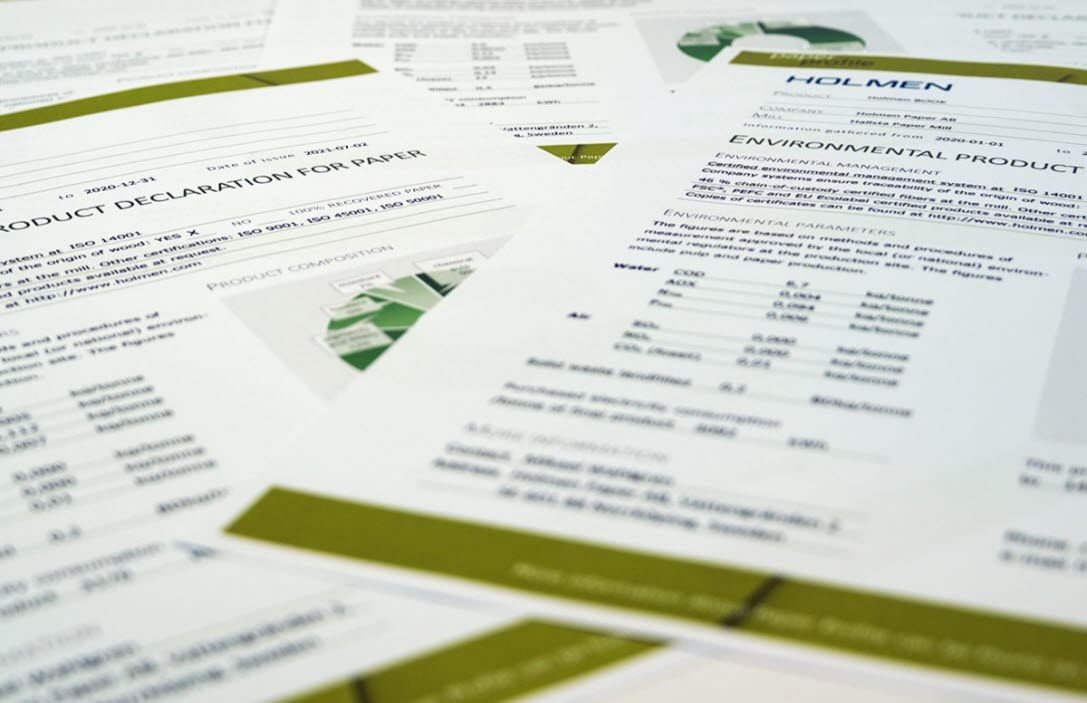
As early as 2001, a collaboration among paper industry suppliers began reporting their environmental impact through the Paper Profile document. Still used today, this voluntary declaration shows direct carbon emissions per tonne of paper at the site of production, along with impacts on air, water, and landfill. The Paper Profile is included in the new Environmental Declaration for every product.
CEPI Carbon Footprint
CEPI, the Confederation of European Paper Industries, began calculating carbon footprints for paper and board products in 2007. Their framework was created to provide guidance and a common structure for these calculations. Our Carbon Footprint still follow their framework, which has been developed over the years to harmonise with other frameworks such as the GHG Protocol and ISO standards.
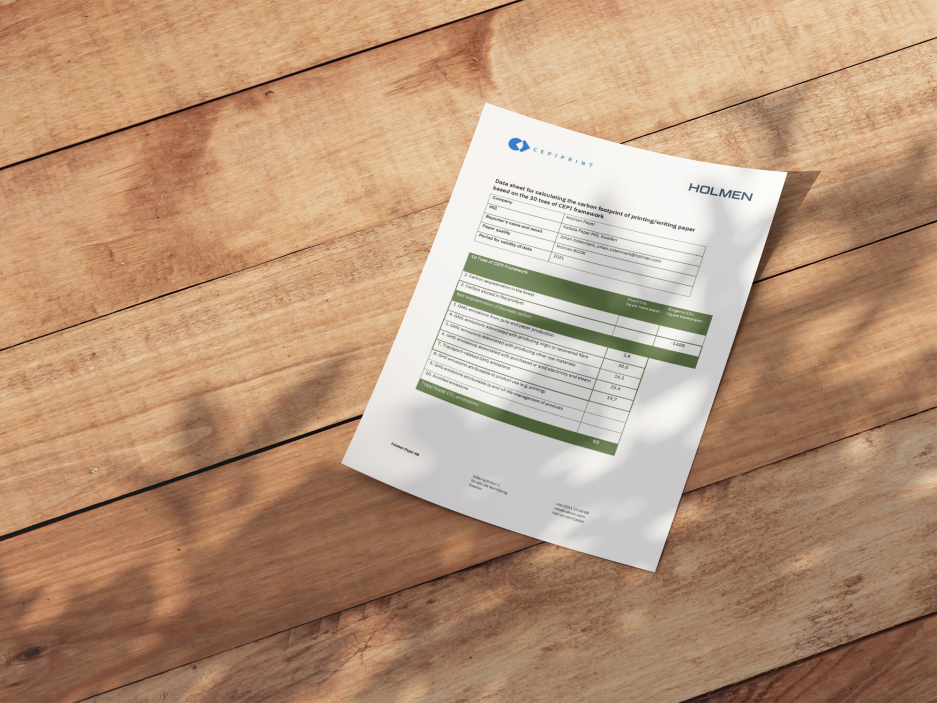
Our product Carbon Footprint covers emissions “cradle-to-gate”, which is mainly the same areas as in GHG Protocol Scope 1, Scope 2, and Scope 3 upstream.
Ascertaining the CO2e of everything
In February 2025, OECD published the report ”The carbon footprint of everything”. It refers to their work on developing standardized methods to calculate the greenhouse gas emissions for every good, service, and firm. The goal is to provide reliable data to drive climate action and support large-scale decarbonisation.
The report concludes that reliable product-level carbon footprint data from suppliers does not only help firms calculate their own Scope 3 emissions but can greatly facilitate reporting at other levels as well. Further efforts by public and private actors can help remove remaining obstacles, but there are still many challenges.
Development of more accurate data
Ideally, all emissions should be measured directly to generate primary data, but this is not yet possible, notes the OECD report "Towards more accurate, timely, and granular product-level carbon intensity metrics: challenges and potential solutions" (2024). Even when emissions are perfectly measured, outputs are not always comparable, the report adds.
Secondary or proxy data often has to be used to enable the calculation of product-level metrics. Both OECD reports recommend using some form of third-party assurance to help identify gaps and align scopes and methodologies for greater accuracy. Standards and guidelines have evolved over the past two decades, with carbon footprint calculations expected to become progressively more accurate and manageable in the future.
Taking a step forward
“We're now increasing environmental reporting for our paper products,” says Jonas Bergström, who works in Sustainability Services at Holmen Board and Paper. “We want to provide the right data for different carbon footprint calculation interfaces, while also showing what's behind the data and acknowledging that sustainability extends beyond the carbon footprint.”

The Environmental Declarations (ED) have been used for Holmen's paperboard products for several years and are appreciated by the customers for providing a bigger picture. They are now introduced for all graphical paper products, as well as book paper, stationary and containerboard.
"On top of the product carbon footprint calculation and paper profile, we have also included information about the mill's carbon emission reporting in accordance with the GHG Protocol, our energy sources, and our origin of wood", explains Jonas Bergström.
Explaining why carbon emissions may vary
The declaration includes explanations for each part to make it easier to understand what lies behind the headlines. As noted above, scopes and methods differ, for example when calculating CO₂ emissions to air for a specific product at the production site in the Paper Profile, compared with calculating GHG emissions cradle‑to‑gate in accordance with CEPI methodology for the product, or for the mill, following the GHG Protocol.
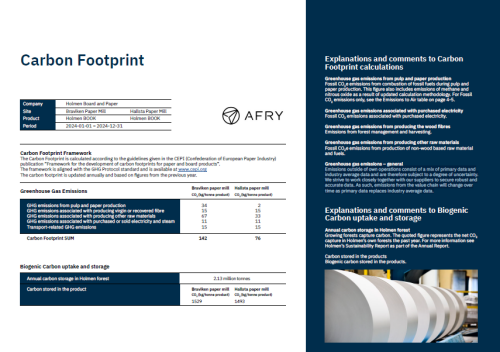
"What's important is that we remain consistent within the chosen methodology," says Jonas Bergström. "Both our Paper Profiles and Carbon Footprint declarations are prepared by the external consultancy firm AFRY, ensuring independent input into our processes."
Increased detail on supply chain upstream emissions
Emissions outside of a company's own operations consist of a mix of primary data and industry average data and are therefore subject to a degree of uncertainty.
"The conversion factors used in calculation models undergo updates and changes over time, and we follow industry standards in cooperation with AFRY", Jonas Bergström explains. "Changes may occur because the availability of primary data has increased in an industry sector. This will lead to increased knowledge about upstream emissions which in turn affects our figures, for example regarding pigments and fillers used in our papers."
There is also a general description in the column to the right, explaining that Holmen strives to work closely together with the suppliers to secure robust and accurate data.
"Increasing knowledge about the factors affecting our carbon footprint is a good thing, because it gives us all the opportunity to make more informed choices," Jonas Bergström says. "It will help us take the right measures to reduce our future climate impact."
Consistently low in third-party comparisons
How does Holmen rank compared to others? Holmen’s carbon footprint is exceptionally low compared to the industry average, based on emission benchmarks from third‑party assessors such as the Fisher Solve® database at Resourcewise. According to their figures, Holmen’s paper mills have a benchmark at around 124 kilograms per ton of paper, cradle-to-gate, while the industry average for graphic paper is 934 kilograms per ton.
“The big difference lies in mill operations,” explains Jonas Bergström. “Holmen’s paper mills are integrated, combining pulp and paper manufacturing in one location, and they run on electricity from fossil‑free sources for the most part. We also benefit from our raw material: the proximity to our forests, the fact that fiber production in Sweden is considered low‑emission internationally, and the relatively small proportion of additives in Holmen’s paper products all play an important role.”
The Fisher Solve benchmark comparison is based on Fisher Solve's calculation of mill GHG emissions, Q2 2025.
"We encourage everyone to make their own comparisons, but to make sure they compare apples to apples", says Jonas Bergström. "Make sure to compare product to product, or mill to mill, and make sure to use the same scope and methods."
Environmental Declarations combined with GRI reporting
Jonas Bergström also want to underline that sustainability is so much more than the carbon footprint.
"The Environmental Declaration is a step forward to provide a wider perspective. How we are working with wood supply is probably equally important for the future", he concludes. "This is why we have included data about the volume of standing timber in Holmen's forest, and we will keep developing the Environmental Declarations for the future."
 Holmen is working to streamline data collection from all Board and Paper's mills, along with annual sustainability reporting in accordance with the Global Reporting Initiative (GRI), which forms part of Holmen’s Annual Report. The goal is to provide a solid foundation for customers and potential partners to make informed decisions.
Find Holmen's Sustainability Report in the Annual Report on pages 98-126.