

Collecting data on emissions along the value chain is a major undertaking, but when doing so, it provides a clear overview of the direct and indirect greenhouse gas emissions of the business. This is because many companies have considerable emissions that occur beyond the factory gates. Failure to report these would give an inaccurate picture of their climate impact, but it can be difficult to define the emissions that occur before purchased goods reach a company, and even more difficult once the products it has manufactured have left the company.
Paper’s climate footprint
As companies raise their climate ambitions, they are also demanding that their suppliers do the same, and many buyers of graphical paper want to know its climate footprint before purchasing. As a paper producer, we believe this is the right way to go.
The Paper Profile environmental declarations and Carbon Footprint reports available on our website show customers what impact Holmen Paper’s products have on the environment and climate. Both are based on life cycle analyses, a common method used to calculate the impact of a product on an environment over its lifetime – in this case from the moment the trees are harvested until the paper is sent for recycling or incineration. The climate calculations made in our Paper Profile and Carbon Footprint documentation are consistent with the thinking of the GHG Protocol.
However, when a paper manufacturer calculates the Carbon Footprint, it is difficult to calculate the emissions that occur after the paper has left the mill, which is why Holmen Paper reports steps 1–7 in the 10-step Carbon Footprint document. The last steps cover emissions from the use and disposal of the product.
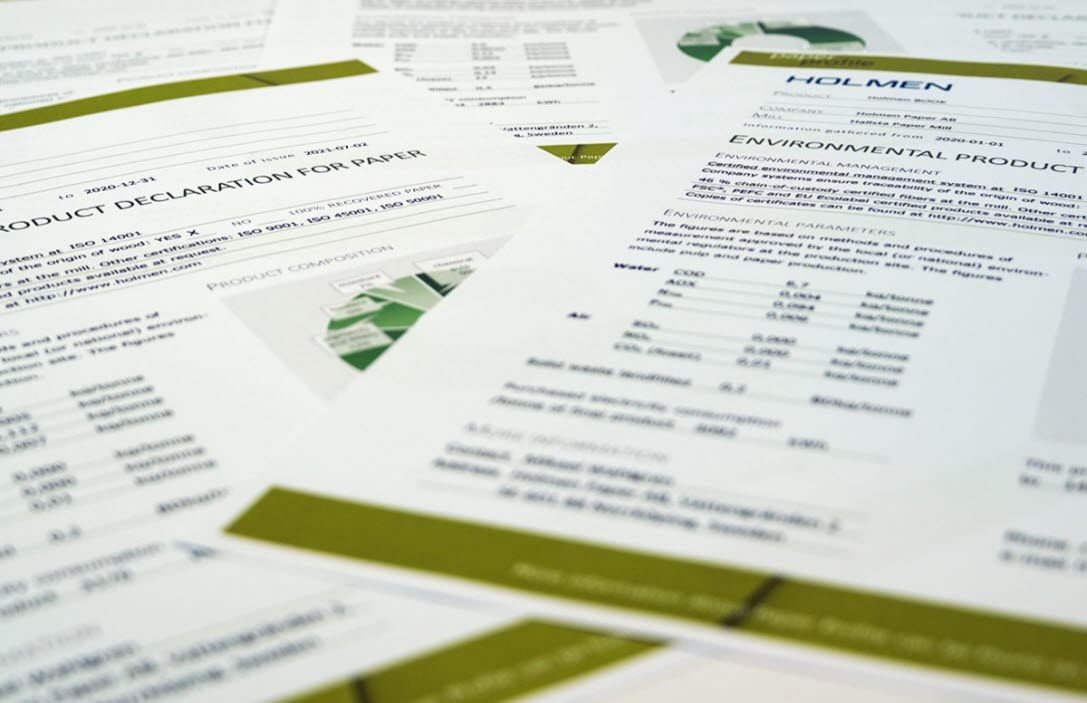
The Paper Profile reports carbon emissions that occur within the confines of the organisation, which corresponds to Scope 1 of the GHG Protocol. Purchased electricity is also shown, and forms the basis for Scope 2 emissions.
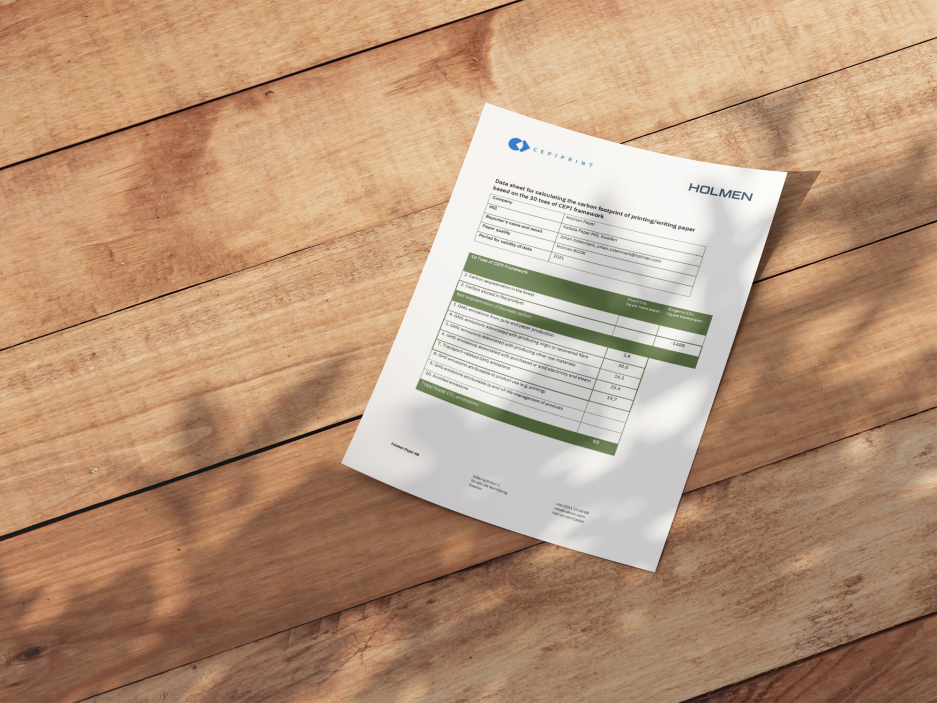
The Carbon Footprint documents follow CEPI’s reporting system and include carbon emissions from processes within the company, purchased electricity, plus raw material production and elements including transport to the company’s gates. This is often referred to as ‘cradle-to-gate’ and corresponds to GHG Protocol Scopes 1, 2 and the part of Scope 3 that looks at the upstream value chain.
Three different scopes
The basic premise of the GHG Protocol is to account for all significant emissions caused by the production of the company’s products and services. With today’s supply chains often being both globalised and specialised, the GHG Protocol has divided emissions into three parts, known as scopes, in a move to create order and structure.
- Scope 1 is emissions caused within the company’s own operations. This includes emissions from the company’s vehicles and machinery, as well as the combustion of coal, oil or petrol in its production and facilities.
- Scope 2 covers emissions from the production of electricity purchased by the company.
- Scope 3 consists of the emissions caused upstream and downstream in the value chain. Upstream, this may relate to material consumption, business travel and employee commuting, while downstream it involves the use and recycling of the product. Paper has one major advantage – it is the most recycled of all raw materials. Over 80 per cent of all paper purchased in Europe is recycled. As Scope 3 is more difficult to calculate, the guidelines state that the most significant emissions should be included. Essentially, it is a case of defining the most relevant areas and focusing on them.
Watch a video about How to calculate CO2 emissions in scopes.
Benefits of using different scopes
There are several advantages to dividing emissions into different scopes:
- It gives a clear picture of which emissions are direct and indirect. Although the indirect ones are beyond the company’s control, they can still be influenced by choosing goods and services that have less impact on the climate.
- Different companies can be compared to each other. The GHG Protocol requires companies to report at least Scopes 1 and 2, but they can also opt to report different parts of Scope 3. For example, Holmen Paper reports all major Scope 3 emissions that occur upstream in the value chain, but not emissions that occur downstream after the paper has left the mill.
- The method provides a picture of how emissions are changing over time and where in the chain emissions are increasing or decreasing. If the majority of companies report their emissions from Scopes 1 and 2, it will be easier for companies further along the chain to calculate the impact of the raw materials and products they purchase, thus enabling smart environmental choices.
How does Holmen Paper calculate emissions?
The Paper Profile reports entirely on the basis of the impact of the processes that take place within the confines of the organisation. The voluntary environmental declaration presents not only the carbon footprint, but also the company’s energy consumption and impact on air and water. The figure for carbon dioxide emissions per tonne of paper produced corresponds to the GHG Protocol’s calculation of direct emissions, i.e. Scope 1. The Paper Profile also provides a figure for energy consumption per tonne of paper. Since Holmen buys all its electricity from fossil-free sources under an emissions guarantee, the figure for fossil carbon dioxide emissions is 0.
Many calculation models only account for fossil carbon dioxide emissions, which have a greater impact on the amount of carbon dioxide in the atmosphere than biogenic emissions, as biogenic emissions are already part of the atmospheric cycle. But note that energy consumption is also shown separately in kWh/tonne for those who want to know, as recommended by the GHG Protocol.
Why does Holmen Paper choose to show more than scope 1 and 2?
With the Paper Profile indicating that carbon emissions per tonne of paper are very low compared with the figures in other mills’ Paper Profiles, it might seem as though Holmen Paper would be better off only reporting emissions for Scopes 1 and 2. However, most models for calculating the carbon footprint of a product try to add the emissions from Scope 3 at a later stage, at least with regard to the largest upstream emissions.
When a model adds a standard figure for upstream emissions, this often ends up being higher than Holmen Paper’s actual Scope 3 emissions, as we benefit greatly from the considerable control that we have over our entire upstream value chain. Data is therefore more accurate when paper users choose to compare our Carbon Footprint documents, which cover carbon emissions from Scopes 1, 2 and “half of scope 3”, i.e. emissions from purchased products and upstream activities.